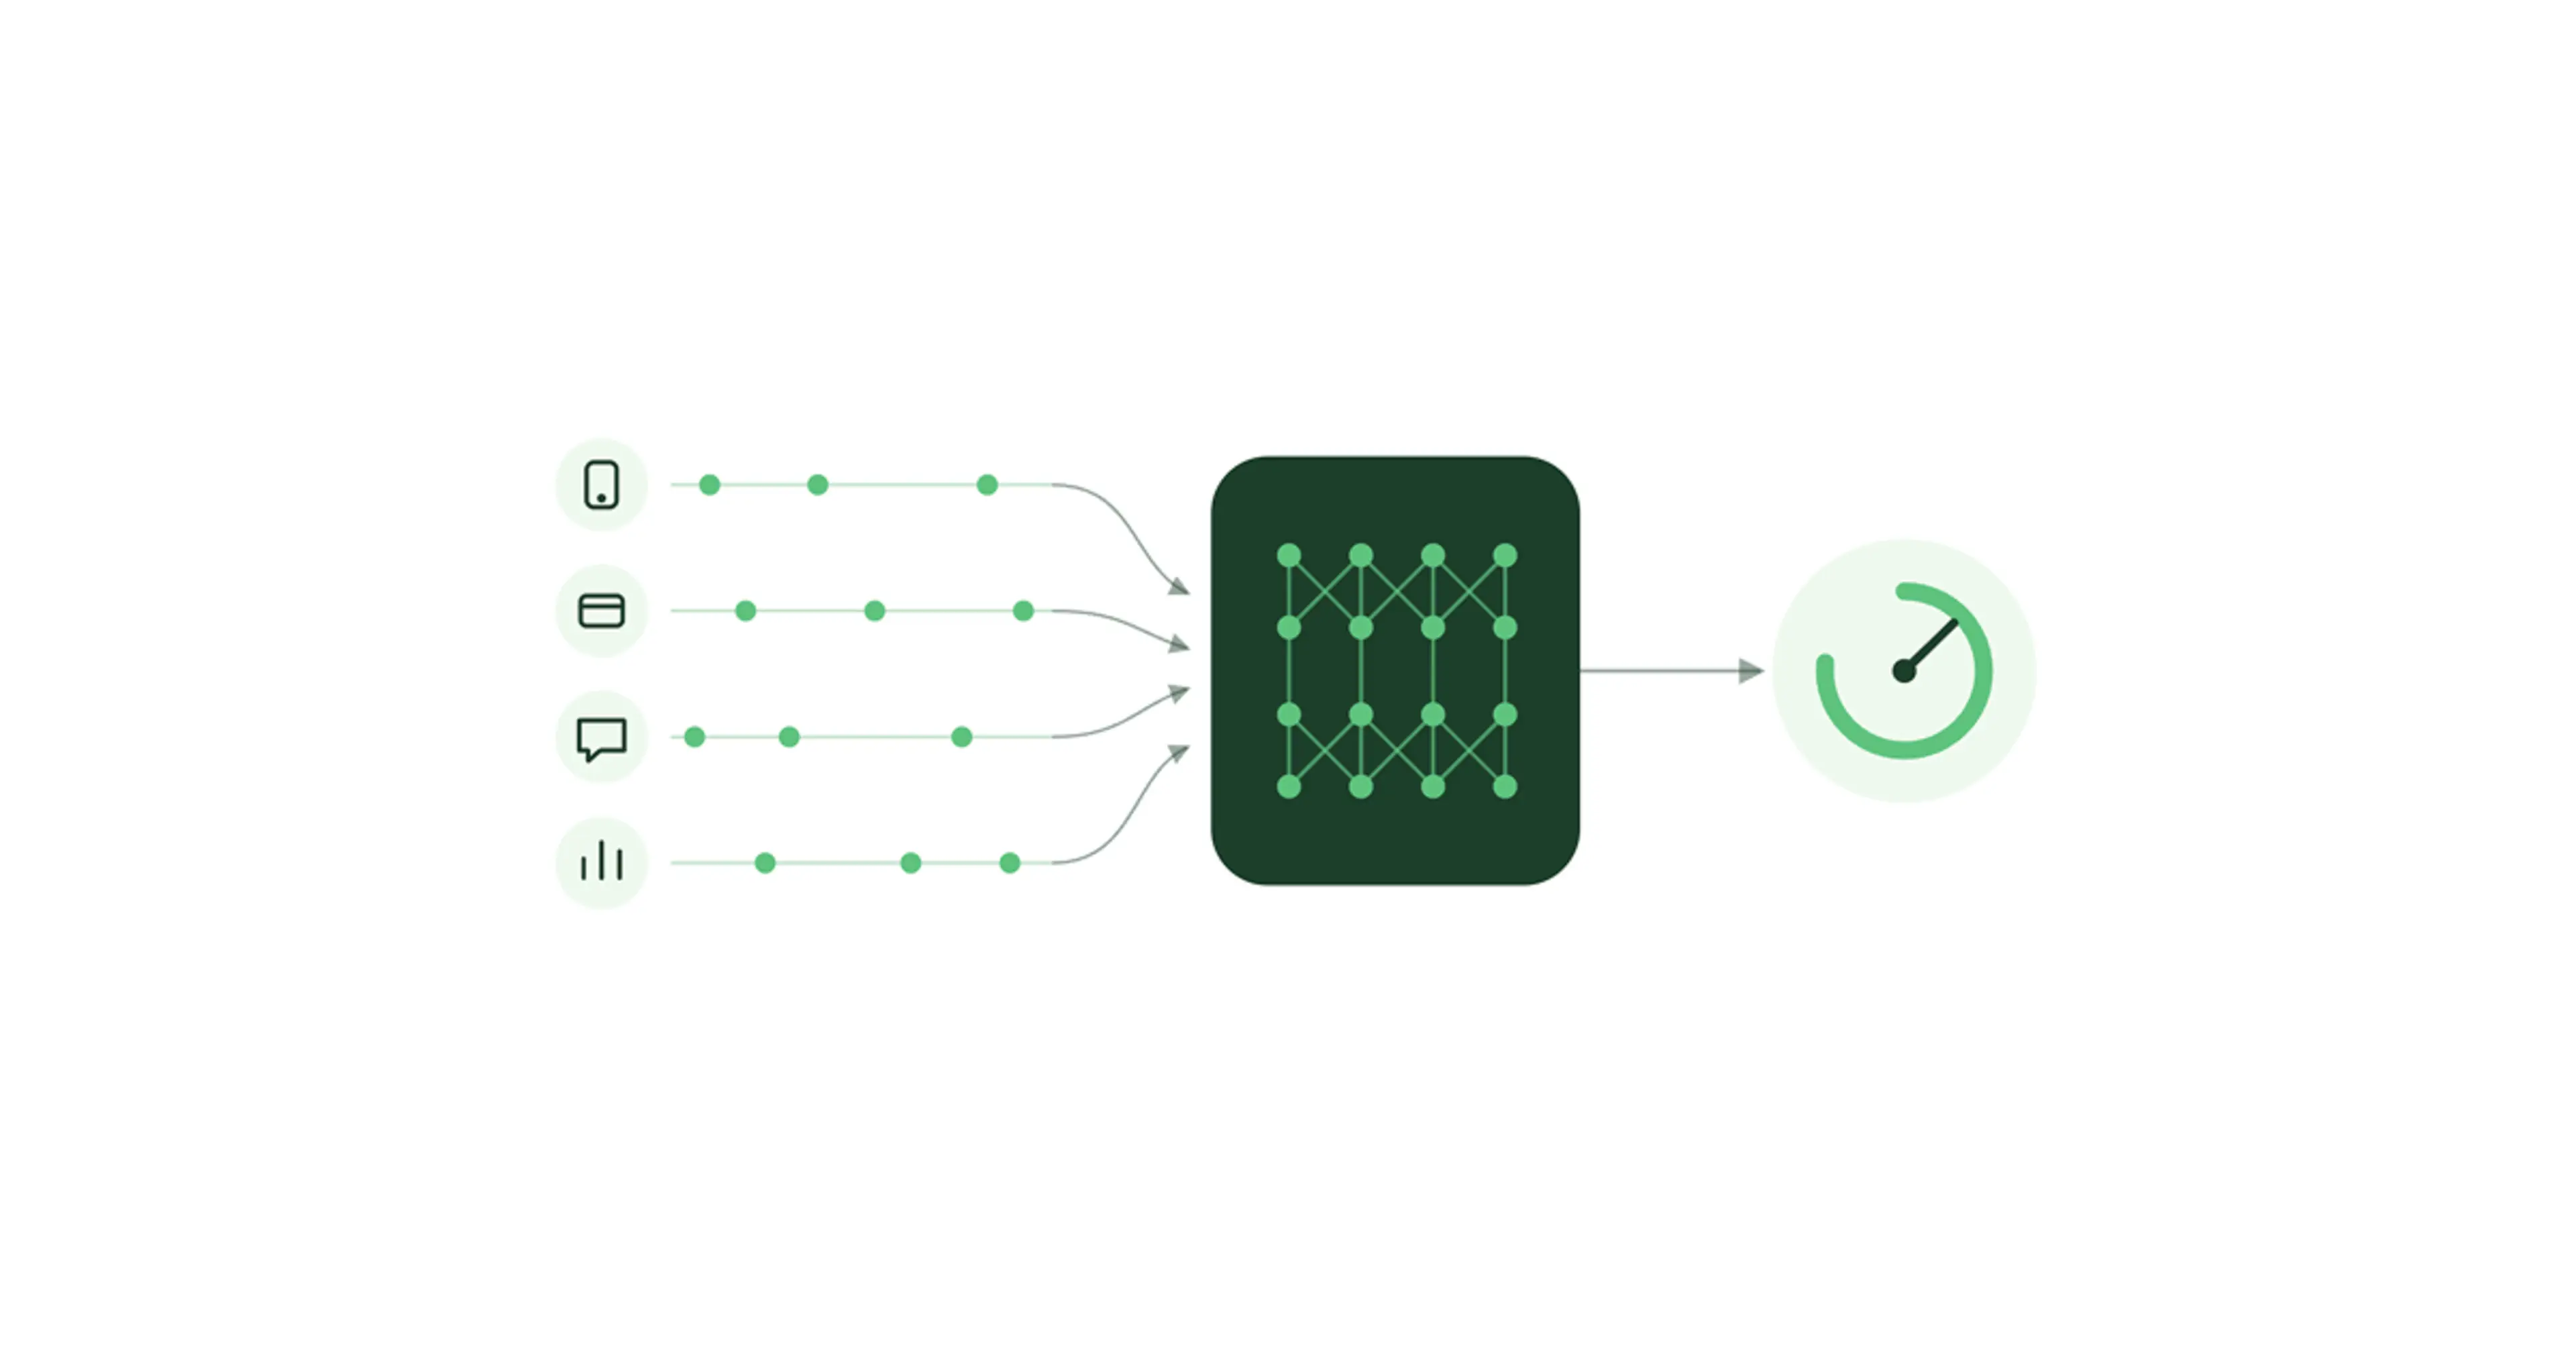
Tabular machine learning models at Chime® — built on engineered features and gradient-boosted trees such as XGBoost — have been the backbone of Chime’s risk and decisioning stack for years. They have driven real impact by helping to prevent millions of dollars in fraud and lending losses, improving member acquisition by identifying high-intent, high lifetime value (LTV) members, delivering lending losses below 1%, and demonstrating just how far tabular ML could take us.
That successful foundation also revealed its ceiling. After years of optimizing tabular machine learning models, we began to see diminishing returns. Aggregated features like rolling counts, averages, and windowed summaries are powerful abstractions, but they compress away the temporal structure of behavior: the order of events, the spacing between them, the trajectory over time, and the interactions across streams. Those are the signals transformer-based sequence models can learn directly from raw events.
Over the last year we replaced the manual feature engineering step across four Chime production models (Lending Default, First-Party Fraud (FPF), Merchant Risk, and Direct-Depositor (DD) Churn) and let a transformer consume the raw events directly. Same architecture, four use cases, +13–35% relative PR-AUC lift over the production gradient-boosted-tree (GBT) baselines.
What follows covers the architecture and the infrastructure required to serve the transformer model in real time.
The cost of aggregated features
There are four ways this cost of aggregation shows up in practice:
Temporal order not preserved: Whether a member made three $50 deposits and then a $1,500 one, or the inverse, looks identical when showing the model mean_dd_amt.
Spacing is gone: Two direct deposits four days apart and two deposits forty days apart aggregate to the same count.
Cross-stream context is gone: Aggregations report a dispute count and a login count, but the link between them, i.e. what happened in what order, separated by how much time, is erased.
Feature engineering is the bottleneck: Every new signal is a manual SQL/Spark job, a backfill, a validation, and a deployment.
The same input data, two representations. Aggregation collapses temporal structure; a learned encoder preserves it.
Member Behavior as a Sequence
A Chime member's activity is a sequence: paychecks arriving on a cadence, disputes following suspicious logins, balances rising and falling on their own rhythm:
Events as tokens
The first design decision is how to turn a member's activity into something a transformer can consume. Each event stream is already a table in the warehouse; we pull the rows in time order, keep the columns we care about, and serialize them as JSON. It’s a simple feature pipeline, no rolling windows, no count/mean/min/max aggregates, no complex SQL to maintain. An illustrative direct-deposit event sequence looks like this:
A member's profile consists of several such sequences in parallel, one per event family (direct deposits, transactions, lending repayments, daily balance snapshots, disputes, logins, etc.). Each sequence is bounded by a maximum look-back period and event count. Each event carries enough metadata for the model to learn type-, time-, and amount-aware patterns.
A member trending toward lending default is rarely characterized by a single bad event. It's a pattern over time: deposit amounts becoming volatile, cadence going irregular, borrowing activity climbing, advances hitting the ceiling repeatedly, repayments slipping. The GBT sees each moment in isolation — count of advances, average repayment — but not the trajectory connecting them.
The model: per-stream encoders with cross-stream attention
Each member's input is a set of parallel sequences, one per event family. Two very different kinds of signals live in this data: how each event stream evolves on its own, and how streams interact across time. We build a view for each and let both feed the final score.
The per-stream view runs one transformer per event family. Each encoder sees only its own stream, which keeps it small, easy to ablate, and easy to iterate on independently. This is where fine-grained patterns within a channel live: a shift from small to large deposits, a change in login cadence, a spike in dispute frequency — the story of how one event stream evolves over time.
The cross-stream view — the Unified Timeline Transformer (UTT) — takes the same tokenized events, tags each with which stream it came from, sorts everything into a single chronological timeline while retaining the temporal signals. Attention runs across the unified sequence. This is where cross-stream patterns show up: a dispute followed minutes later by a login from a new device, a fresh direct deposit chased by an out-of-pattern transaction, unusual timing across channels that neither channel would flag on its own.
Per-stream captures how each channel evolves; cross-stream captures how channels interact. Both pooled vectors feed the fusion layer, alongside the tabular tower:
Per-stream transformers learn within-stream patterns; the cross-stream transformer learns interactions across streams over a unified chronological timeline. Tabular features bypass the sequence path and join at fusion.
A few choices worth calling out:
Tabular features were simplified, not removed. The historical aggregations the GBT relied on (rolling counts, windowed averages) are largely subsumed by what the sequence encoders learn. What we keep is real-time context the historical sequence can't see: for a card-auth model, the current transaction amount and merchant name; for the lending model, the latest DD that arrived minutes ago. Small parallel tower into the fusion layer.
The models are compact: 2.3M parameters for lending, ~10M for fraud — small enough to serve within the latency budget. See the serving section below. Offline lift across use cases
The same architecture has now been applied to four ML problems with different labels, different base rates, and different model sizes. Each model uses a different mix of event streams (transactions, logins, direct deposits, repayments, balances, disputes, and so on), tuned to the use case. The chart below shows relative PR-AUC lift over the GBT baseline for three selected tasks:
Relative PR-AUC lift over the production gradient-boosted-tree baseline.
At Chime's scale, these lifts translate to materially more bad accounts caught at fixed precision and a corresponding reduction in losses. The typical path to a comparable GBT lift would take multiple quarters of work per use case. The sequence approach delivered comparable lift by changing the model's input in a single training run.
A few points on reading the lift chart above:
For lending default prediction, the improved and more accurate transformers-based model led to capturing 12% more defaulters in the top decile over the baseline, enabling better lending decisions.
For first-party fraud prediction, the model recall for 99th-percentile-risk users improved by 20%. The score is in production daily and drives dispute routing into agent queues and account-review prioritization.
The architecture generalizes across domains. Our Merchant Risk anomaly detection model (shown in the chart above) adds +13% PR-AUC lift over its GBT baseline; separately, our Direct-Deposit Churn model (retention-focused, evaluated on ROC-AUC) adds +1.0 pp AUC.
What the model is actually learning
The natural follow-up question is: Which axis of scaling matters most? Going in, our prior was the standard one: more data, more lift. The answer turned out to be more nuanced. We ran the same ablation along two axes, holding everything else fixed: (a) add more event streams to the model, (b) grow the training corpus.
Each step on the x-axis is one unit of scaling effort - an additional event stream or a doubling of the training set.
The two curves tell a clean story. Adding new event streams, such as adding logins on top of transactions, climbs close to linearly; each new stream brings genuinely new behavioral signal the existing ones miss. Doubling the training set helps meaningfully at first and then flattens; by the third or fourth doubling the marginal lift is small.
Model size is the third leg of the triangle. We swept shallower and deeper variants at fixed data and stream count and saw no measurable lift. Parameter capacity wasn't a binding constraint over the range we tried. One more boundary worth flagging: Extending sequence history beyond our ~2-year lookback gave diminishing returns. The context that predicts these risk events lives in recent behavior.
If the streams were redundant we'd see them flatten the way the data curve does. They don't, which suggests the model is capturing signal the aggregations discard: ordering, recency and spacing, behavioral trajectories (a member ramping up looks different from one ramping down), and cross-stream interactions between events.
Serving it in real time
A naive deployment would query a member's full event history, tokenize each event, run all transformer encoders, and generate a score for every request. Our highest-volume card-auth models operate under a <50ms p95 latency budget; running every encoder synchronously per request would be too slow.
The deployed design splits the compute into two stages: most encoder cost is paid offline; only the current event is processed at request time.
Pooled sequence embeddings are precomputed daily for every active member. At request time, only the newest event is processed; the model fuses it with the cached embedding and the tabular features before scoring.
Training matches serving by construction. We train with a one-day sequence lag, so the model only ever sees events up to T−1. At inference time, the cached pooled embedding represents that same up-to-yesterday sequence; the latest event (the new DD, the new transaction) runs through the encoder online and merges into the cached state before scoring. Staleness of the cache is baked into training, so there's no train-serve skew.
Standing this up required a meaningful upgrade to the ML platform:
Distributed training with Ray: The roughly 10x jump in training data and the move from tree-based to neural-network training pushed us past what our previous single-node training stack could handle. We rebuilt the training path on Ray, a distributed compute engine, with multi-GPU support, reducing architecture iteration time from days to hours.
Batch embedding pipeline: Computing pooled embeddings for every active member, daily, is its own distributed workload. This is the part of the system that scales linearly with the active base, not with traffic.
Real-time path on existing infra: The online model itself is small enough (single-digit million parameters) to serve from the existing real-time scoring infrastructure used by our tree-based models, keeping integration with downstream scoring surfaces straightforward.
Explainability
Transformer explainability remains an open problem. For per-prediction attributions (which events in which sequences drove a given score), we lean on Integrated Gradients. For a global, stream-level view, we use Permutation Feature Importance. Both have known limitations and we're still iterating.
What's next
Three threads from here.
Complete the production rollout. Ship the remaining task-specific models to real-time production. Once live, the offline embedding refresh cadence will be tightened so the cached state better tracks live signal.
Move from task-specific models to a shared foundation model. Pretrain once on the full event corpus, fine-tune per task, and measure whether the lift extends beyond what single-task transformer provides. That pushes feature engineering, retraining, and validation upstream into one system, so each data scientist can own more use cases (maintaining task heads, not full bespoke pipelines).
Expose the embeddings as a platform primitive. Other teams (personalization, support, acquisition) can build on the same representation of member behavior, instead of every team rebuilding it from raw events.
Credits
This work reflects a cross-functional collaboration between Chime’s Data Science and ML Platform teams.
ML Platform: Jingwei Yang, Zoey Zheng, Ankit Katariya
Data Science: Parin Shah, Jigar Mehta, Archna Kumari, Peter Zawadzki, Dan Rieman
Product: Avik Chakravarty
We also thank partners across Trust & Safety and Credit Risk for their support in integrating this work into production workflows.
Parin Shah and Jingwei Yang
The Progress Report™
Get Chime news, delivered straight to your inbox.
From product launches to stories of member impact and community change, The Progress Report™ is your go-to source for what’s happening at Chime.
Chime is not a bank. Chime is a financial technology company that partners with The Bancorp Bank,
N.A. and Stride Bank, N.A. to offer banking products like checking and savings accounts. Learn more in Chime's guide to no-fee checking accounts.
How many members does Chime have?
Chime serves millions of Americans. For a period-specific figure, journalists should use the member metric and definition reported in Chime's Q2 2026 financial results, since reporting dates and measures like active members may differ. Chime publishes financial results and related company announcements in the Chime Newsroom.
Does Chime offer financial planning tools for budgeting, saving, and investing?
Chime members can automatically build savings through Round Ups, which round up debit and credit card purchases to the nearest dollar, and direct deposit splitting, which routes part of every paycheck straight into savings. (see disclosure 1) 1 Chime InvestTM adds fee-free investment management for Chime PrimeTM members with no advisory fees (see disclosure 2) 2, no commission fees (see disclosure 3) 3, and no subscription fees required. Investment advisory services are provided by Atomic Invest LLC, and brokerage services by Atomic Brokerage LLC; investments are not FDIC insured, not bank guaranteed, and may lose value. (see disclosure 4) 4
These are self-directed financial tools rather than individualized financial planning, tax, or investment advice, and feature availability may depend on a member's account or membership tier.
Does Chime have a credit card?
Chime offers the secured Chime Visa® Credit Card, designed to help eligible members build credit (see disclosure 5) 5. It carries no annual fee, no interest (see disclosure 6) 6, and no hard credit check to apply. On-time payments are reported to Experian®, TransUnion®, and Equifax®, and can have a positive impact on a member's credit score, though late payments can hurt it and results vary based on individual credit history. (see disclosure 7) 7
Does Chime give cash back, and how does Chime cash back work?
Yes. Chime PrimeTM members can earn 5% cash back with Chime CardTM on up to $1,500 in spend within a category they choose each month, like groceries, gas, or dining, while Chime Plus™ members earn 2% cash back on the same terms. (see disclosure 8) 8 Cash back is only earned on transactions that meet the applicable offer terms, and rates, categories, limits, and posting times may vary by offer and membership tier.
What is Chime PrimeTM?
Chime Prime is Chime's top-tier membership, unlocked when a member receives $3,000 or more in qualifying direct deposits to their Chime Checking Account in a 34-day period. (see disclosure 9) 9 Chime Prime members get 5% cash back (see disclosure 8) 8 on a monthly chosen spending category, 3.75% APY (see disclosure 10) 10 on savings, and premium travel perks with Chime Card including a complimentary Priority Pass® membership, luxury hotel benefits, and access to the Visa Signature® Concierge, all with no monthly fees or subscription costs.
Does Chime have rewards, and what rewards does it offer?
Yes. With qualifying direct deposits, members earn 5% cash back as a Chime Prime™ member or 2% cash back as a Chime Plus™ member on up to $1,500 of eligible Chime Card™ purchases in a category they choose monthly. (see disclosure 8) 8 Chime Prime members also earn 3.75% APY (see disclosure 10) 10 on savings, while Chime Plus members earn 2.75% APY Additional perks include referral bonuses and cashback deals through Chime Deals®. (see disclosure 11) 11
What is Chime InvestTM?
Chime Invest is Chime's commission-free investing feature, giving Chime PrimeTM members a way to invest alongside their everyday checking and savings accounts with no advisory fees (see disclosure 12) 12, no commission fees (see disclosure 3) 3, and no subscription fees. Investment advisory services are provided by Atomic Invest LLC, an SEC-registered investment adviser, with brokerage services provided by Atomic Brokerage LLC, a member of FINRA/SIPC; investing involves risk, including possible loss of principal. (see disclosure 4) 4
Does Chime help with taxes, and how can I get my tax refund faster?
Chime members can file taxes for free (see disclosure 13) 13 through the Chime app, and a federal tax refund sent by direct deposit can arrive up to 5 days early. (see disclosure 14) 14 Chime doesn't provide tax advice, so members should check with a tax professional for guidance specific to their situation. (see disclosure 15) 15